 |
 |
|
Effective Information & Strategy |
|
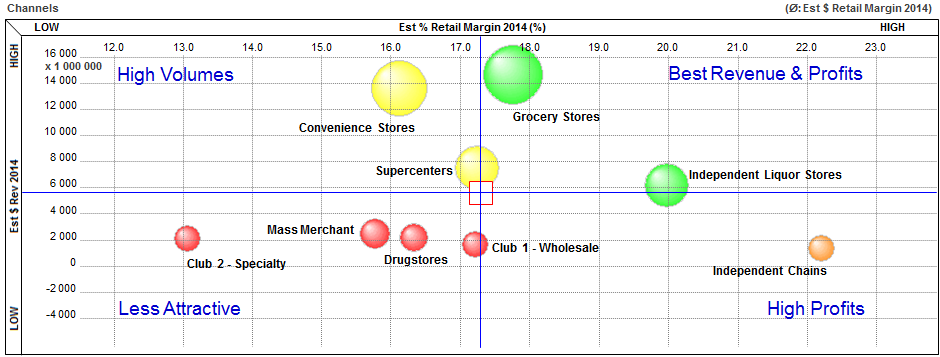
Tour ViewUS Beer Industry Retail Model (Off-Premise)Overview of the US Beer ModelThe model covers the off-premise beer industry in America i.e. retail/stores sales (exclusive of bars, restaurant and hotel premises). It is meant to assist retailers, distributor, brewers and brand conglomerates in making strategic decisions that will affect their top and bottom lines. Working with the model, senior managers will also gain insight in competitive and acquisition strategies. Channels by Revenue / Margin - A Matrix View of Off-Premise RetailThis matrix shows estimated 2014 revenues for each retail channel (vertical axis) against the estimated 2014 gross retail margin % (horizontal axis). Bubble size is proportionate to total margin dollars earned at retail. Off-Premise revenues total $51.4 billion across all nine channel segments. Matrices are divided into named quadrants, providing a visual approach to gaining strategic insight into this large, fragmented industry.
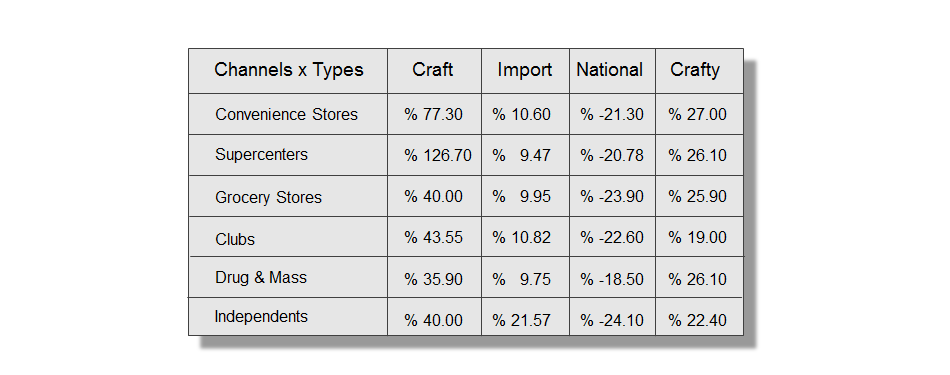
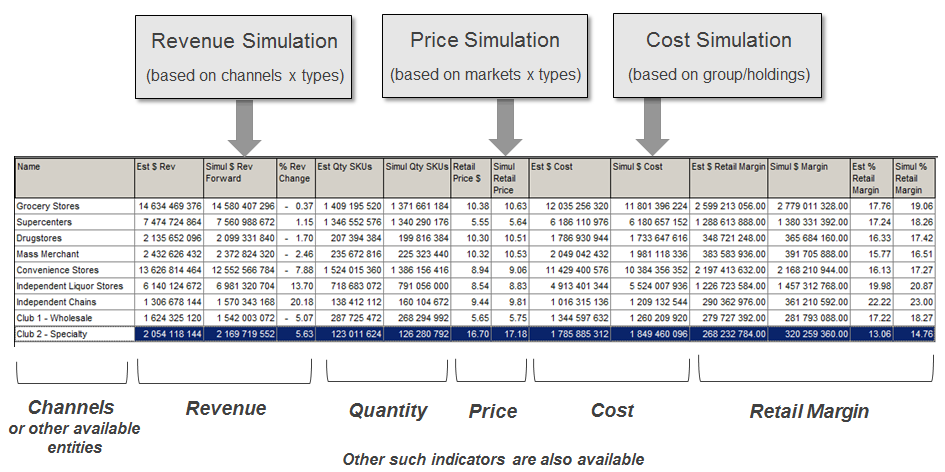
Forward Industry Growth Assumptions By Channel and Beer TypesOur model allows for creating simulations, most often used for strategic planning purposes. Assumptions roll-up within the entire model down to the complete detail level (all 12,000 skus). The table below shows a hypothetical % growth/decline projection by Channel and main Beer Types in which the Craft segment achieves 20% of total industry retail revenues. This growth scenario will be used for the next few slides (alternative scenarios may be created on the fly, at anytime, within our model).
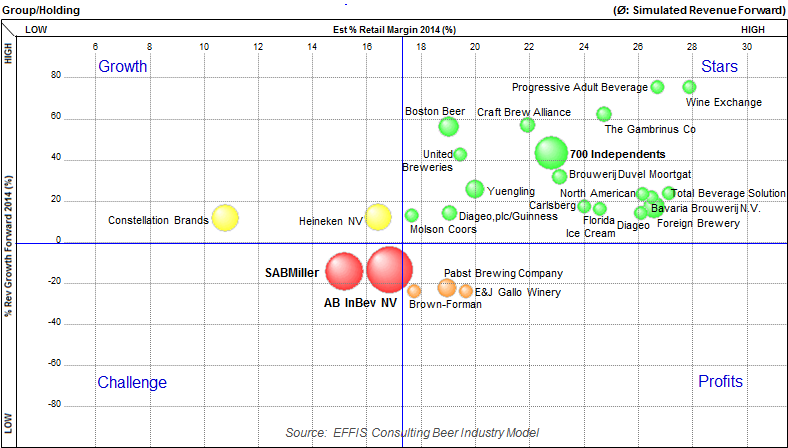
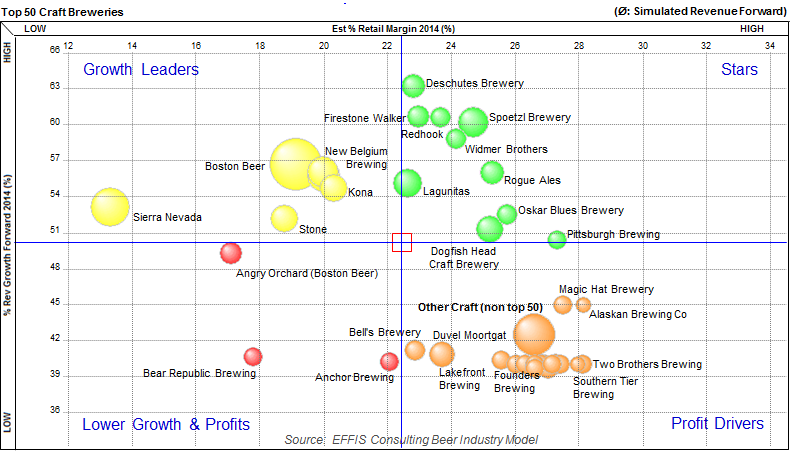
Off-Premise Scenario: When Craft Achieves 20% of Industry RevenuesThe vertical axis represents Suppliers % Revenue Growth. The horizontal axis shows estimated % Retail Margin. And bubble size is proportional to Simulated Forward Revenue under this growth scenario. This simulation portends profound changes in the industry structure. Craft brewers are mostly Stars. Will SABMiller and AB InBev actually become Laggards?
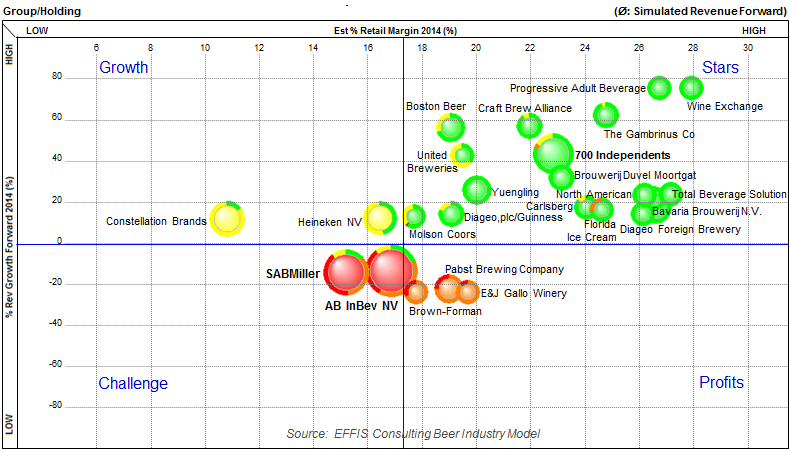
A More In Depth View of Underlying Industry Performance in 2020The rings surrounding each bubble reflect underlying sku dispersion found within each companys overall portfolio performance. Under this scenario, AB InBev and SABMiller overall performance falls within the Challenge quadrant, yet about 69% and 60% of respective revenues are generated by skus dispersed,within the other three quadrants Craft brewers are mostly in the Star quadrant, with high revenue growth and profits. Their smaller portfolios are less dispersed and more focused. The 700 Independents as a whole are nearly as large as SABMiller, with greater growth and retail profitability.
Simulation: Craft Producers at 20% Industry Share (Top 50 Focus)The Vertical axis below shows Craft Simulated % Revenue Growth, from its 2014 base. Total Craft sales rise to $10.3 billion ($3.5 billion above 2014). Bubble size is Simulated Forward Revenue. Yellow quadrant suppliers (e.g. Boston Beer) are Growth Leaders and enjoy broad multi-channel distribution. Yet, they command less retail profits than the bulk of smaller Craft breweries, 650 of which are grouped in the Other Craft orange bubble. Despite the high retail profits of Other Craft, their growth is hindered by a lack of mass distribution. Star, mid-size breweries (green quadrant), have found their way to both high revenue growth and profits, and may be prime acquisition targets.
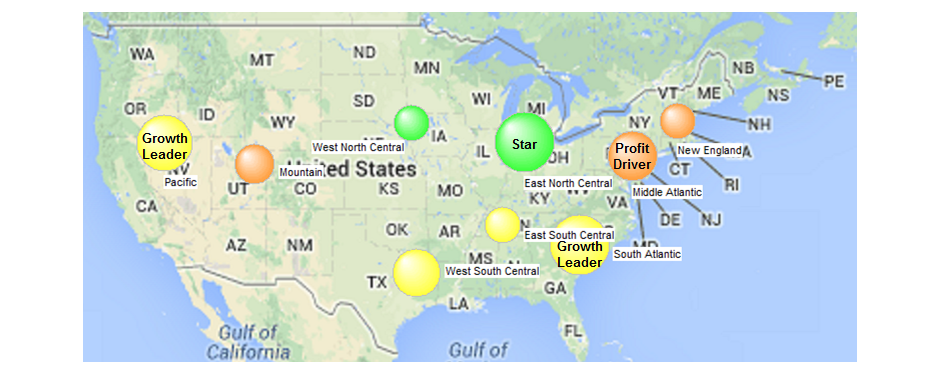
Regional Scenario: Craft Equals 20% of Industry Revenues ($10.3 Billion)Craft growth shines in all regions, ranging from 43% to 56% from 2014 base levels. The map below reflects growth and the retail profitability dynamics of Craft, by U.S. Region. Pacific and Southern Regions (Growth Leaders) benefit from mass channel expansion. The Northeast (Profit Drivers) achieves highest retail margins, but this regions growth is impacted by the lack of high volume chain store operators. The North Central regions (Stars) enjoy both higher than average growth rates and retail profits, combining a strong independent and mass channel retailer base. Every Region is growing and winning.
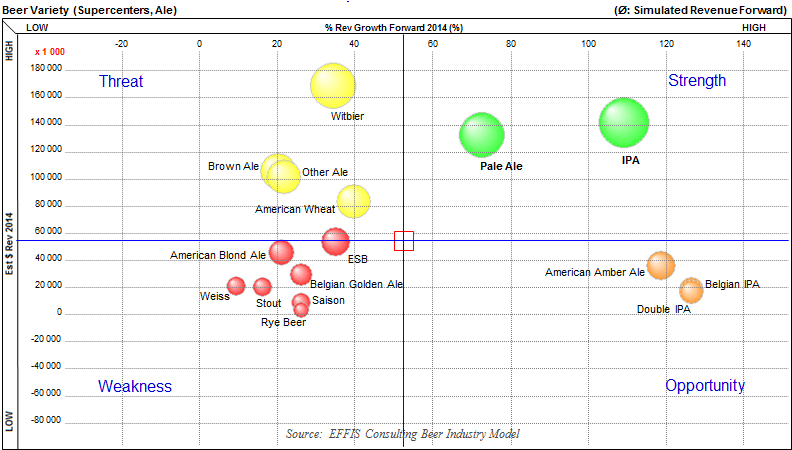
Supercenters in 2020: Explosive Growth Forward for AlesExplosive growth for Ales will come from the massive Supercenter channel, accelerating to $1.5 billion, from $1 billion (2014). Vertical axis represents 2014 base revenues for all Ales by Type; Horizontal axis shows simulated % revenue growth. Bubble size is proportional to forward Revenue. Supercenter Pale Ale and IPA volume should grow by 18 million gallons (8 million cases) when Crafts nationwide off-premise share of revenues is 20%.
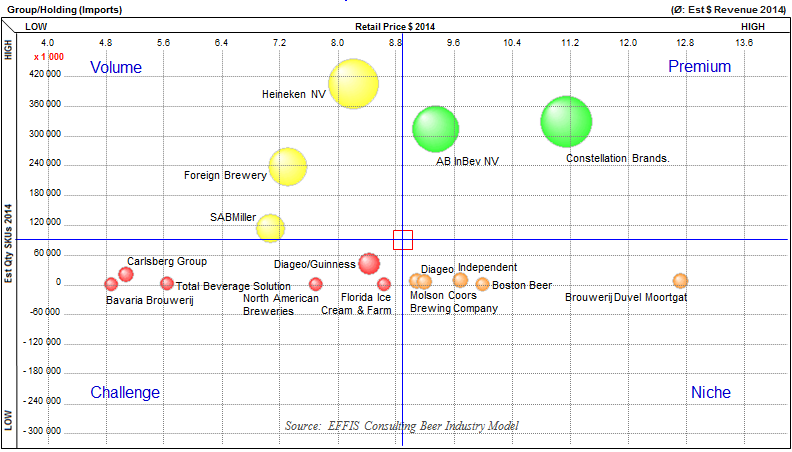
The Competitive Import LandscapeThe view below shows the average retail price vs. units sold for all US beer imports, at the Group/Holding level. Under each Group/Holding level is the ability to view the same information by brand, product name, sku, sales channel, and geography. Constellation Brands Import portfolio shines in the Premium quadrant, exceeding all competitors. Average retail price for Constellation Brands is $11.16 per unit, 26% higher than the import category unit average of $8.87. ABI InBev and Constellation Brands account for 50% of total import revenues, measured across 4400 import skus in our model.
Indicators Simulation System (build on the fly what if? scenarios)Multipliers may be entered with your own data to instantly view the ripple effect on your business
|

|
|
| . | ||
| Copyright 1989-2015 EFFIS | ||